[thumbnail]
Electric Vehicle (EV) adoption is accelerating in many commercial vehicle sectors driven by a combination of business factors, such as improving economics and model choice, and policy factors, like the impending ban on sale of diesel vehicles and introduction of clean air zones.
Because of the flexibility of diesel technology, uniform vehicle and infrastructure choices are today suitable for many operators. The picture changes substantially when EVs are considered because of their differing capabilities and higher upfront costs. Substantial capital cost reductions (above 20%) can be achieved by adopting optimal mixed equipment strategies that still satisfy all operational needs. As EV deployment costs could run to tens of millions for some operators, considering your charger and vehicle choices carefully could substantially improve the returns from your investment in EVs.
EV’s Can be the Cheaper Option Today
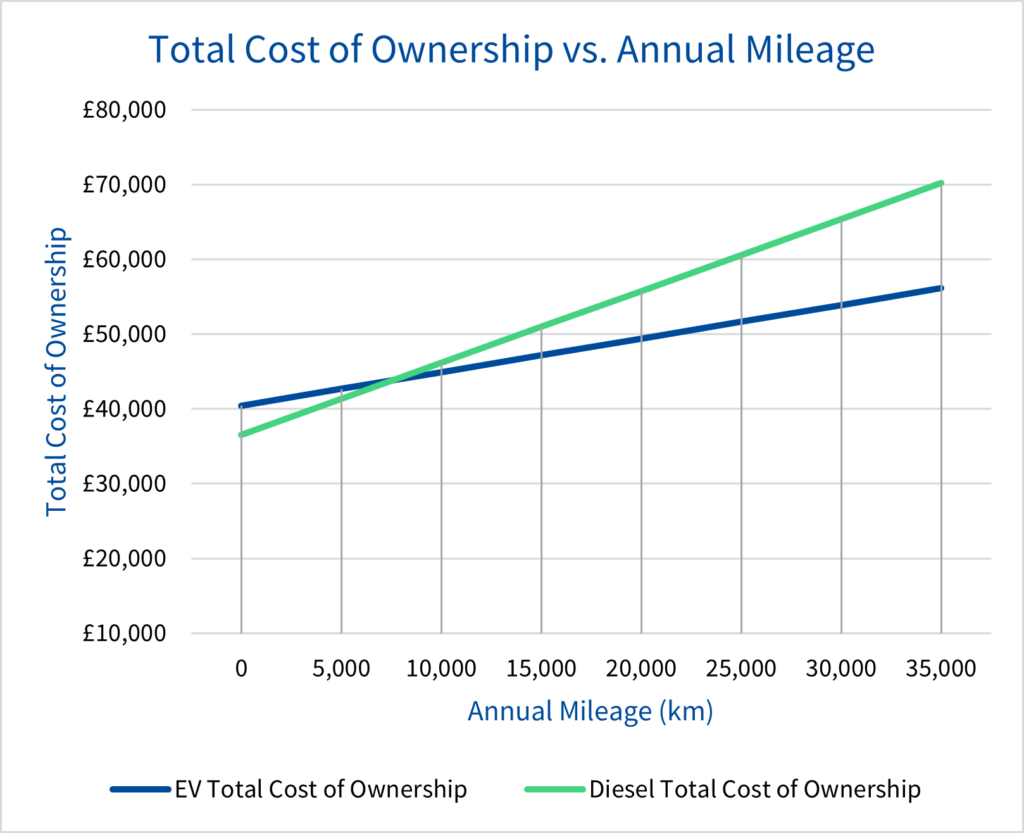
Reduced costs and extended ranges of electric vans entering the marketplace over the last year mean that EVs are already cheaper in some applications than their diesel counterparts. The figure below shows comparative total cost of ownership over 6 years of electric and diesel variant Vauxhall Vivaros. Breakeven with current costs and subsidy can be as low as 7,000km p.a. today for some vehicle models.
However, taking a more specialised approach to equipment choices can unlock significant additional savings, particularly in relation to capital costs which are often higher for EVs and their infrastructure than diesel vehicles.
We recently undertook an optimisation study for a major grocery retailer to see how much they could reduce their EV deployment and operating costs by. Whilst the study is confidential, we can illustrate the scale of saving from using the same FPS optimisation tools on randomised data sets.
Sources of Cost Reduction
Using an Optimum Mix of Vehicles
Roughly half of an EV fleet’s costs come from the initial purchase of the vehicles, so choosing an optimal mix of vehicles for each site can have a big effect. The chart below shows a typical distribution of mileages at a large urban depot. Whilst a few vehicles complete journeys over 140 miles in a single day most vehicles generally complete shorter trips.
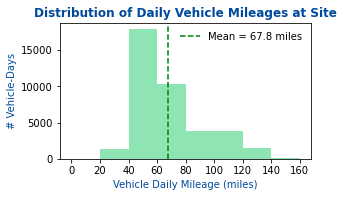
We used FPS’ EV deployment modelling tools to simulate the full variability seen over a years’ worth of operations under different scenarios whilst allocating vehicles to routes on a daily basis. We found that using smaller battery packs was feasible for about 67% of the vehicles in a site with over 100 vehicles.
As an indication of the saving potential the price differential for large and small battery packs in even a small vehicle like the Vauxhall Vivaro-e is about £5,000 per vehicle. Vehicles coming to market soon with much larger battery pack options will have battery pack price differences up to £15,000 per vehicle. This translates to potential capital cost savings of £0.3-1M for a site of this type.
The savings will increase in operation as vehicles with smaller battery packs tend to be more efficient as they weigh less.
Smart Charging
For a fleet of 100+ EVs, charging the vehicles each day will result in around 4 MWh/day extra energy demand. Our smart charging algorithm creates a charging profile for each vehicle that takes advantage of time-of-use electricity profiles, cutting electricity costs by more than 25%. This is achieved by reducing the energy demand at periods of high energy prices, while ensuring all vehicles are charged each night according to their scheduled journeys plus a contingency.
Unmanaged and smart profiles are shown in the chart below along with a sample electricity price series
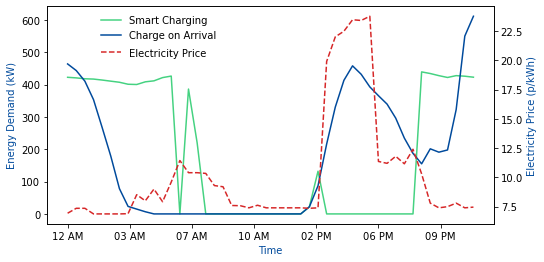
As an indication of potential cost savings: 4MWh of daily energy use 363 days per year at an average cost of 14p/kWh is about £203,000 per year in electricity spend. Reducing this by 25% will result in a recurring saving of more than £50,000 per year.
Selecting the Right Charging Infrastructure
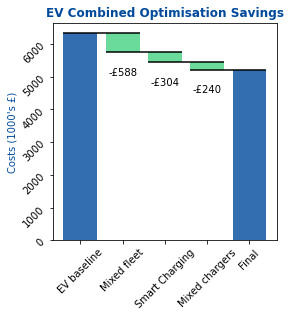
The next large cost associated to an electric fleet is that of the chargers. However, as in the case of battery packs, our analysis suggests that most vehicles can be charged at relatively low powers most of the time, with only occasional high-power charging. In this regard our analysis shows than an optimal mix of chargers at each site can reduce the initial purchase and installation cost of chargers by up to 40%. At a 100 vehicle site, charger and infrastructure costs could run to £600k even without DC charging, therefore a 40% saving would reduce capital spend by £240,000.
The chart below shows the cumulative impact of savings on the 100 vehicle site over a 6-year asset life run to more than £1.1 million.
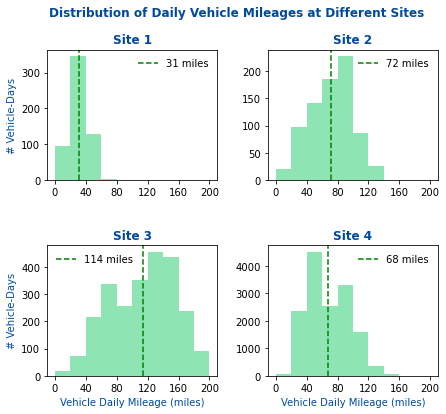
Variation Between Sites
In the supermarket study we looked at some quite different locations, including smaller sites, and found that significant optimisation savings were available. One of the key observations was that the solutions were different for sites across the estate because the vehicles were undertaking different tasks. The chart below shows an anonymised range of mileage distributions seen at sites we considered. This variety of daily energy requirements need different combinations of vehicles and chargers. The benefit of FPS’ software tools for undertaking this type of analysis is that it is possible to simulate multiple sites to find the best answer for each of them.
If you would like to learn more about electrifying your fleet or FPS’ work, get in touch with me via sofia.taylor@flexpowerltd.com